Learn how to populate some pages in your publication as a user of Publish Pro. This example end-to-end process adds visuals and slicers to a new publication and explores how you can professionalize your data layout using the design tools. It also steps you through the creation of a simple schedule, which builds your publication once, creating one output PDF for each of the items in the slicer.
Note: This content guides you through the simplest end-to-end version of creating and saving a publication to get you familiar with the overall process. For more detailed guidance on each of the processes that you might follow when building your publication, see Building Publications in Publish Pro.
Before you begin
This walkthrough assumes that you are a Publish Pro user. If Publish Lite opens, then you should follow the Publish Lite walkthrough instead.
- Click here for the Publish Lite walkthrough
End-to-end process
Step 1: Create a new publication
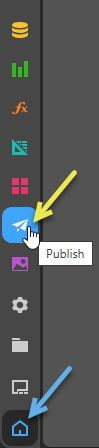
From the App Toolbox on the Pyramid home page:
- Click New Publication (yellow arrow).
- To create a document publication with the default settings, just click Create in the bottom corner of the page.
The New Publication launcher opens.
A new publication is created with the default theme, page orientation, and size.
More information
This step provided the simplest entry point that you can use to create a new publication in Publish Pro. If you want to learn more about this process and about the other options that you may select when creating a publication, see the following topic:
- To learn more about building publications, see Building a New Document in Publish Pro
- To learn more about inline email publications, see Building an Inline Email in Publish Pro
Step 2: Add a cover
The publication that you just created uses the default theme selected in Step 1 to define the publication's colors, fonts, styling for visuals, and even "master pages" (that add some common graphics, text, and so on to all the pages of your publication). This step is going to create a new front page or "cover"; the cover will be styled according to the same theme and used to professionalize the publication for your audience.
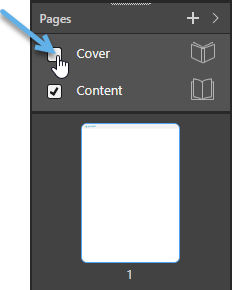
From the Pages panel:
- Select the Cover checkbox (blue arrow).
- Add a Corporate Logo to your cover:
- From the Toolbox, click the Import Image option (yellow arrow, below) and navigate to your image on your local machine.
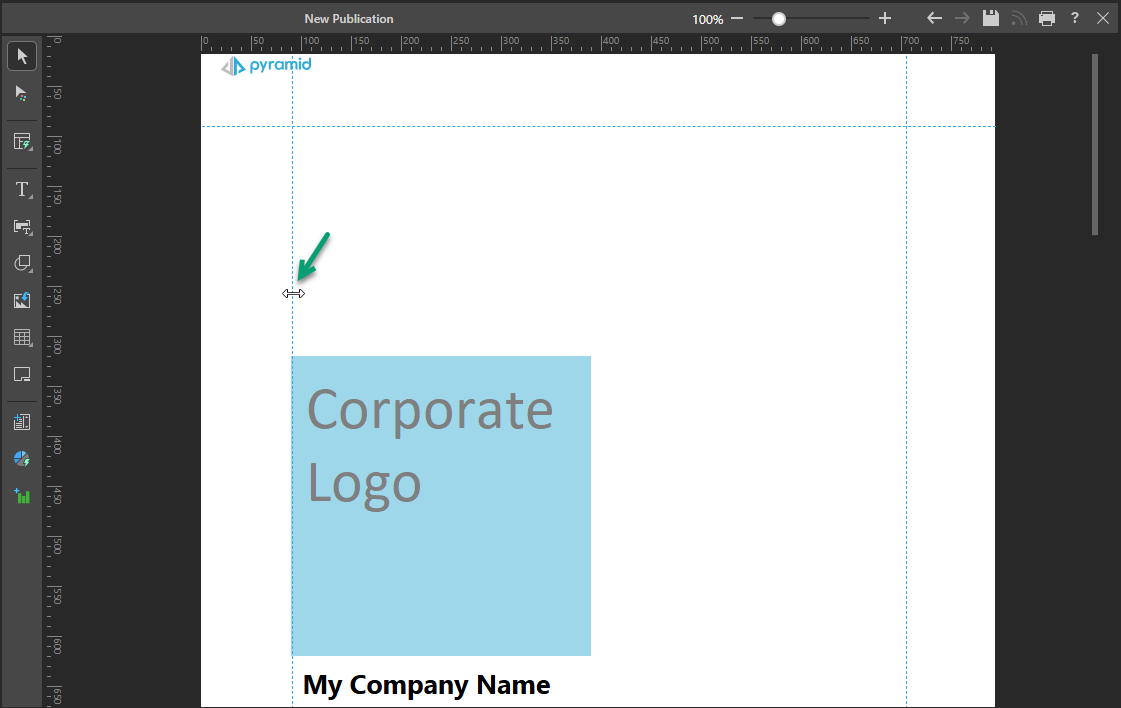
- Optionally, move your image to an appropriate position on the canvas:
- Resize the image using the handles that are visible at its corners and edges when it is selected.
- Reposition the image by dragging it to a better position.
Your image is added to the canvas in a "selected" state.
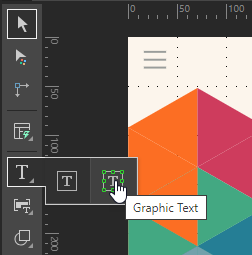
- Add a Title for your publication:
- From the Toolbox, right-click Text > Graphic Text.
- Click the canvas at the point where you would like to add your company name.
- Type your company name and resize and reposition the text field by grabbing its handles.
A text box is added to the page at the selected point.
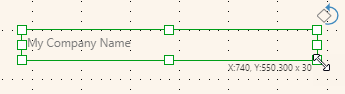
Since this is Graphic Text and not a standard text field, resizing the text box also resizes the text contained within the box.
If this option is available, page 1 in your publication is updated to use the Master associated with a Cover. The cover will include some additional background images and layout details that make it different to any of the other pages in your publication.
Your basic cover is created. You might want to add extra content here, such as a copyright notice or the names of authors, a publication date (perhaps using variable text fields, so these are variable values), and so on.
More information
The purpose of this step was to demonstrate that you can change some options in Publish Pro to create a cover, to add some styled text, and to add an image. There are lots of other styling and formatting options, including changing the theme that controls the colors and updating the masters that affect formatting across your publication. For more information about these options, see the following topic:
- To learn more about covers, themes, and styling, see Formatting and Design in Publish Pro
Tip: As well as applying your master to your publication, you may also want to edit the master's content (for example, to add an image to every page of this publication or to include your corporate details on the master). For more information, see Master Pages in Publish Pro.
Step 3: Enable layout tools (optional)
There are several layout tools in Publish Pro that help you to build perfect publications without having to deal with lots of design complexity. This step is going to set up some vertical and horizontal "guidelines" to help you to control the arrangement of items on your pages, managing where they are positioned relative to one another.
- If you navigated away, you need to click on Page 1 in the Pages panel to return to the first page.
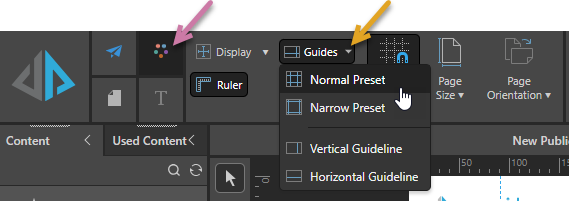
- Go to the Design ribbon and select Guides > Normal Preset:
- You can drag the guidelines to different positions if you need to.
Margins are added to the canvas as blue dotted lines. Note that these lines will not be shown in the published document, they are intended to guide you when you are creating your publication.
Note: Your cursor changes to a double-headed arrow when you are in the correct position over the guideline to reposition it (green arrow below). A pop-up also tells you the current position of the guideline as you reposition it.
When you create new pages, you may need to "show" these same guidelines by clicking Guides in the Design ribbon. Having the same guides on every page helps you to position your visuals and other content items in the same place on every page:
Tip: When you use this functionality to create your own publications, you might want to add more guidelines to your canvas; to indicate where other content items should be placed, or to give guidance about the size of, say, a main heading in each page.
More information
The purpose of this step was to demonstrate that there are tools in Publish Pro that help you to achieve a professional look and feel. As well as guidelines, there are other options that allow you to show a grid, show or hide rulers, and align or distribute the content items that you add to your pages. For more information about these options, see the following topic:
- To learn more about the layout tools, including guides, see Layout Tools in Publish Pro
Step 4: Add a one-off visual
Now that you have created your cover and added your guidelines, you can add a new page and place a new visual on that page.
Important: This is probably the most important stage of creating your publication. You will add some analytic content that you want to share with your audience. In this case, creating a one-off visual that only exists within this publication and cannot be reused by other users or in other publications using Smart Reporting. You could, instead, add shared visuals from the content manager. For more information, see .
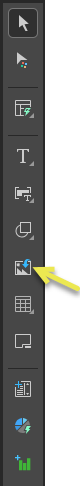
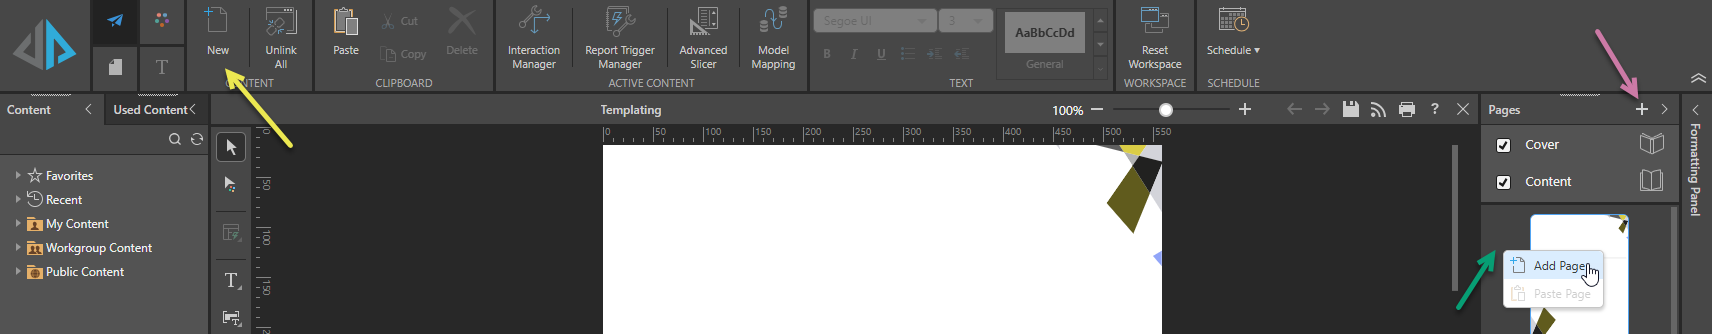
- Add a second page to your publication, by selecting New on the Publish ribbon (yellow arrow) or, in the Pages panel, Add Pages on the right-click (green arrow) or Plus from the panel header (purple arrow):
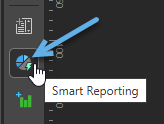
- Create a visual using the Smart Reporting tool in your Toolbox:
- Click Smart Reporting (blue highlight above).
- Select the data model that contains your data. You can select a model from your Recent or Favorites views or navigate through the Explorer view to your model.
- In Smart Reporting, you can start building your discovery using one of the following options:
- Use the Chatbot (purple arrow above) to describe the data you want to add to your discovery. A prompt like "Sales by Manufacturer by Country" will add multiple chips to the Item Selection bar above the canvas.
- Click Select Data + (green arrow) to add measures (quantitative data) and then hierarchies or filters (qualitative data) to your visual. Note that each time you make a selection, a chip is added to the Item Selection bar and the visual is redrawn.
- The first time you access this panel you can only add Values (also called Measures).
- Subsequently, you can add Values, Dimensions, or Filters.
- Click here for the help materials for Smart Reporting.
- Once you have built your visual, click Finish.
- Move your visual panel to the correct place on your canvas and resize it as required.
Note: The new page has a very different appearance to the first page you added, because it is a content page and not a cover page. Your publication can only have one cover page.
The Model Selection panel opens with your Favorites displayed by default.
For detailed steps describing this process, see Opening a data model in the Discover section of this help file.
![]()
You can also change the visualization type, change your theme, and change the quick styles in Smart Reporting. For an overview of the Smart Reporting tool, see:
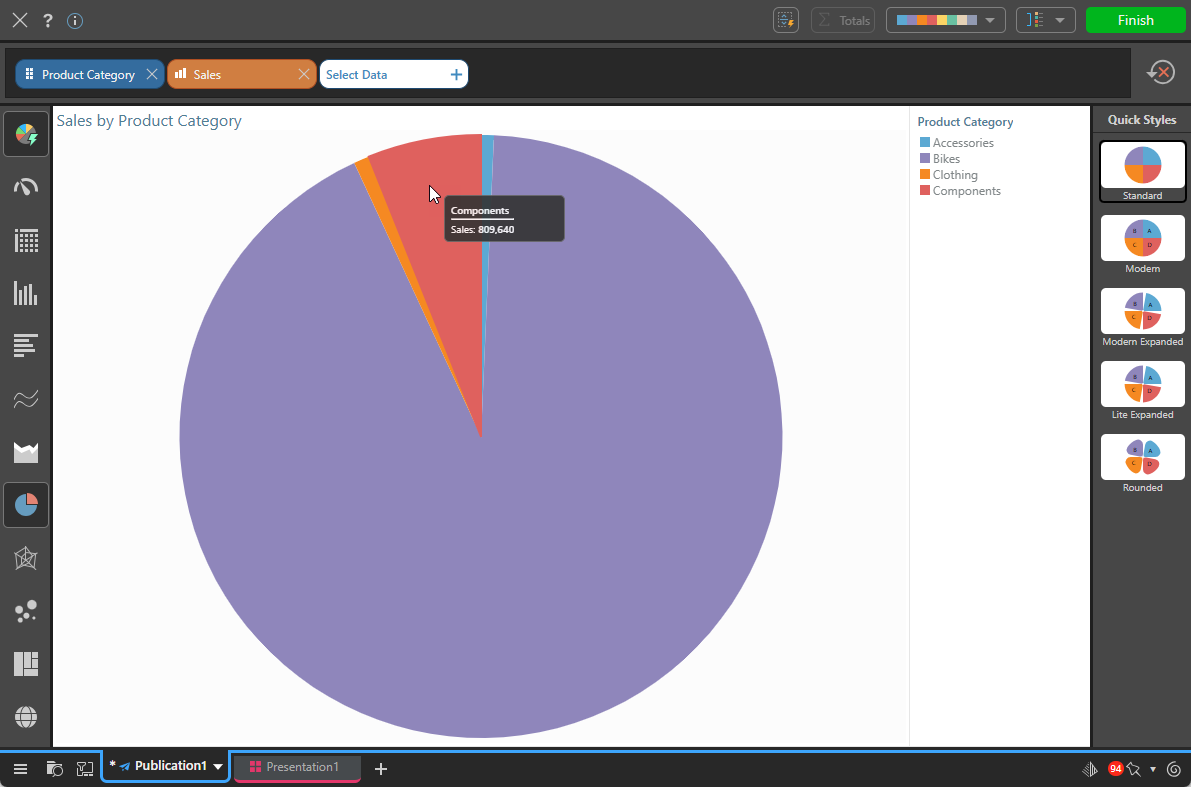
Smart Reporting closes. Your new visual is created and embedded in your presentation or publication.
If you followed the preceding steps to create a visual containing a Sales measure and Product Category dimension, Smart Reporting will have built a simple Pie Chart:
More information
The purpose of this step was to demonstrate adding some analytic content to your page for your reader. There are lots of different types of content items that you can add to your pages. For more information about these options, see the following topic:
- To learn more about creating and adding visuals, see Adding Content Items in Publish Pro
Step 5: Add a slicer
Now that you have created a new visual, you should create a slicer that will allow that visual to be filtered by Country when you build your publication. It is important to note that Slicers in Publish are very different to slicers in Discover or Present; they are not an interactive feature that will be used at runtime, but are used to select an appropriate value for the publication at build time.
- From the Toolbox, click the New Slicer option.
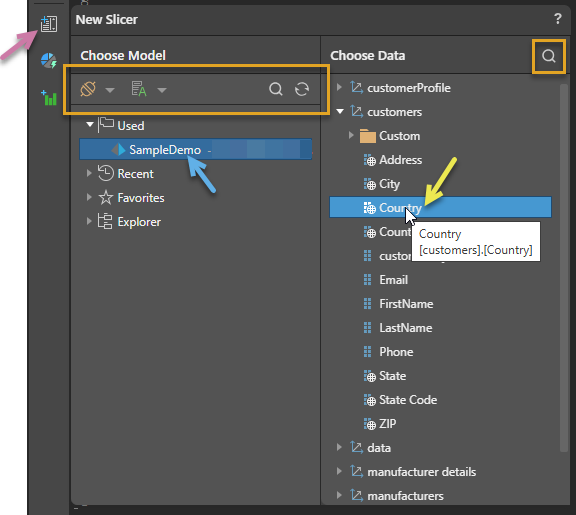
- Select the Model and Data that you want to use:
- Choose Model: To use the same Model as you used for the visual, select the model under "Used" in the Choose Model panel.
- Choose Data: To filter the visual by Country on build, double-click "Country" in the Choose Data panel.
- Select the checkbox between your new Country slicer and the visual:
The New Slicer panel opens.
When you double-click Country, the Interaction Manager opens at the bottom of the page with the new Slicer in the From column.
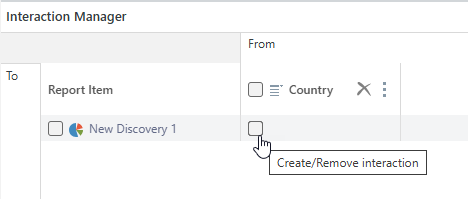
The purpose of this interaction is to connect the visual that you created in step 4 and the slicer that you just created. In Publish, the slicer has no effect at this point, it will only impact the output document when it is built.
More information
The purpose of this step was to demonstrate adding and configuring a very simple slicer for your publication. For more information about these options, see the following topic:
- To learn more about creating and adding slicers, see Managing Slicers in Publish Pro
Step 6: Save the publication
Before you can schedule a build of your publication, you need to save it.
Save your publication to your My Content folder by clicking Save in the status bar at the top-right of your canvas:
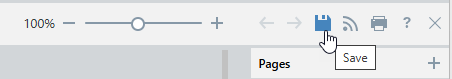
This saves your publication locally.
More information
This step describes how to save your publication locally. If you want other members of your team to be able to use or edit your publication, and you have sufficient access rights to do so, you should save it to your workspace or public folders.
- To learn more, see Save and share publications
Step 7: Schedule a Build
In the last step of this process you will create a Schedule that builds a PDF for each of the countries in your slicer. In each output PDF, the data in the visual reflects Sales in the country selected from the slicer for the output document.
From the Publish ribbon:
- Click Schedule:
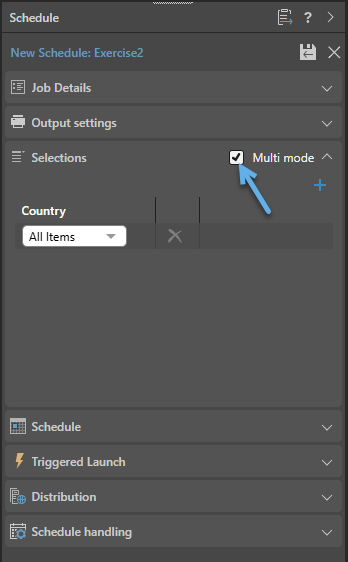
- From the New Schedule panel under Selections, select Multi mode. This selection indicates that the Schedule will create an output document for each of the Countries in the selected slicer.
- It is worth having a look at the other sections and their content at this point. Note that:
- Under Job Details, the default type is PDF.
- Under Schedule, the selected options are Once and Now. (You are creating a schedule that will run once, right away.)
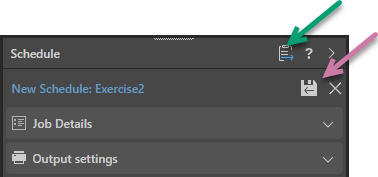
- Once you are ready, click Save and Launch (purple arrow below):
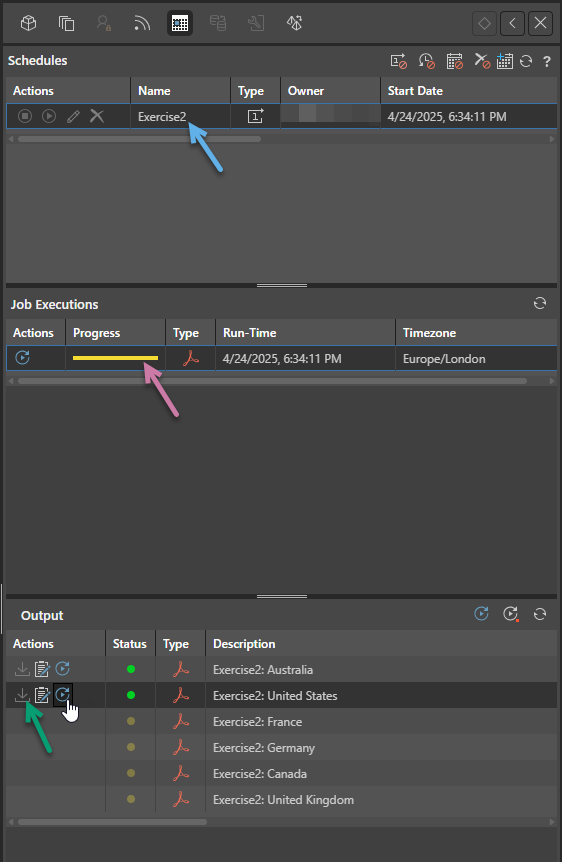
- Click Go to Schedule listing (green arrow above) to open the Content Explorer with the Schedules panel for this publication open. Note the following:
- The top panel shows the schedules associated with this publication (blue arrow below). The Type column indicates that this schedule will run Once.
- Selecting the schedule shows the jobs associated with that schedule in the middle row (purple arrow). The Progress bar indicates the status of the job.
- Selecting the job shows the output publications (in our case, PDFs), that have been built by the selected job. Note that there is one PDF for each of our countries, and its name reflects that country. Once the PDF is successfully built, you can download and open it from here (green arrow).

More information
Your schedule built PDFs for each of the countries in your slicer, but does not "recur" in future or when the model is reprocessed. You can make a number of other selections, including recurrence and so on, using the same New Schedule panel. For more information about the alternative options, see:
- To learn more, see Scheduled Publishing in Publish Pro
Alternative processes
To learn how to build a publication either using AI or in the Publish Lite app: